Data Flow Diagram: Concepts, Symbols, Types, and Tips
What is a data flow diagram? Why draw data flow diagrams? What are the symbols of a data flow diagram? What are the rules for data flow? What is the difference between logical and physical data flow diagrams? If you are looking answers to these questions, then you’ve come to the right place. In this post, we’ll try to answer the above questions.
Data Flow Diagram:Concepts, Symbols, Types, and Tips
What is a data flow diagram?
A data flow diagram (DFD) is used to represent the flow of data in a business information system. It expresses the procedures involved in the transmission of data in the system from input to storage.
Data flow diagrams can be divided into logical data flow diagrams and physical data flow diagrams. The logical data flow diagram describes the data flow at the business level involved in completing a business function, while the physical data flow diagram describes the data flow at the system level.
Why draw data flow diagrams?
A data flow diagram visualizes the functions or processes used to find, edit, store, and distribute data to facilitate communication between users and system designers. The structure of the data flow diagram also allows developers to analyze the system from a high point, and then generate a series of diagrams for in-depth analysis.
What are the symbols of a data flow diagram?
Data flow diagrams have four basic symbols.
Process:
A process is responsible for receiving input data and producing output with different content or form. The process can be as simple as storing the collected data in a database, or as complex as analyzing the data and generating reports. Each process has a name to identify the function it performs. A name consists of a verb followed by a singular noun.
Example:
- Apply Payment
- Calculate Commission
- Verify Order
Notation:
- A rounded rectangle represents a process
- For ease of reference, processes are given IDs

Process Example:
Data Flow:
A data flow is the path by which data moves from one part of an information system to another. A data flow can represent a single data element, such as a customer ID, or a set of data elements (or data structures).
Example:
- Customer_info (LastName, FirstName, SS#, Tel #, etc.)
- Order_info (OrderId, Item#, OrderDate, CustomerID, etc.).
Data Flow Example:
Notation:
- The straight line with the input arrow is the input data flow
- The straight line with the output arrow is the output data flow
Note: Since each process transforms data from one form to another, each process must have at least one input data flow anSd one output data flow.
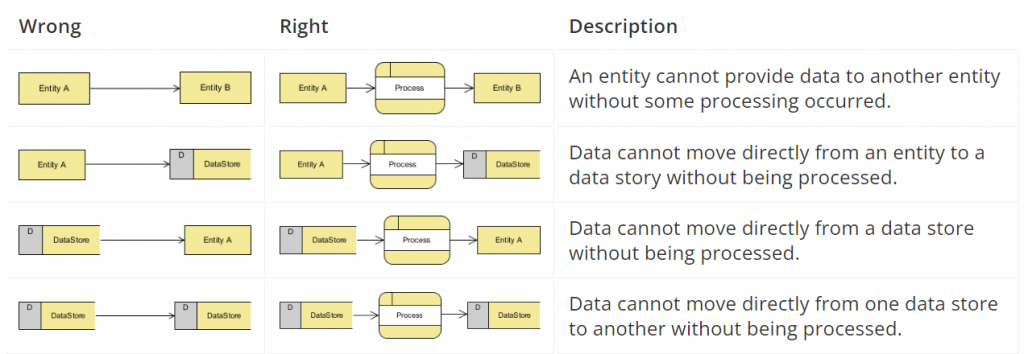
Some Data Flow Rules
A major principle of data flow diagram is that data cannot be transformed into another form by itself, and data must be processed by a program before it can be distributed to a certain part of the system. With this rule, we can very easily identify wrong drawing and correct it.
Other common mistakes:
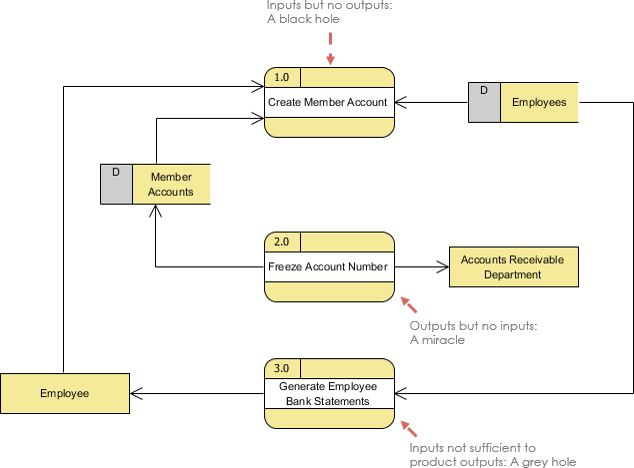
Type 2 errors occur when the output of a process step does not match its input, and they can be categorized as:
- Black Hole – A program step may have input flows, but no output flows.
- Miracle – A program step may have output flows, but no input flows.
- Gray Hole – The output of a program step may be greater than the sum of its inputs.
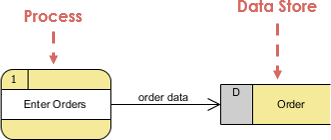
Data Storage
Data stores or data repositories are used in data flow diagrams to represent situations in which the system must retain data because one or more processes need to use the stored data at a later time.
Notation
- Data can be written to the datastore, indicated by the outward arrow;
- Data can be read from the datastore, which is represented by incoming arrows;
- For example: Inventory, Accounts Receivable, Orders, and Daily Payments.
![]()
Data storage example:
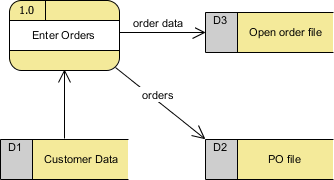
Notice:
- The data store must be connected to the process with a data flow.
- Every data store must have at least one input data flow and at least one output data flow (even if the output data flow is a confirmation message).
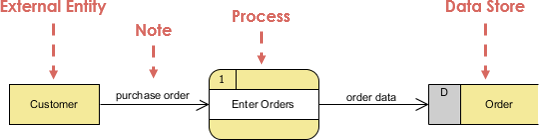
External Entity
External entities are individuals, departments, external organizations, or other information systems that provide data to the system or receive output from the system. External entities are components outside the boundaries of an information system. They represent how information systems interact with the outside world.
- A rectangle representing an external entity;
- They either provide data or receive data;
- They do not process data.
Notation
- Customer submits order and then receives bill from system
- A vendor issue an invoice
![]()
External Entity Example
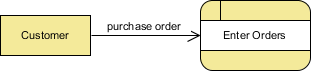
Notice:
- External entities are also called terminators because they are the source or final destination of data.
- External entities must be connected to the process through a data flow.
Logical and Physical Data Flow Diagrams
Logical data flow diagrams mainly express business and business operations. It doesn’t care how the system will be built. We can ignore implementation details, such as computer configuration, data storage techniques, messaging or messaging methods, and focus on the functions performed by the system, such as data collection, data-to-information conversion, and information reporting.
The physical data flow diagram shows how the system will be built, including the hardware, software, files, and people in the system. It enables the correct implementation of the program described in the logical data flow diagram to achieve business goals.
Benefits of Logical Data Flow Diagrams:
- The logical data flow diagram mainly presents business information. The diagram is centered on business activities, so it is helpful for communication and communication with users.
- Logical data flow diagrams are drawn based on business events and are independent of a specific technology or physical layout, which makes the system more stable.
- Logical data flow diagrams allow analysts to gain a better understanding of the business being studied and identify the reasons behind decisions.
- A system based on a logical data flow diagram is easier to maintain because business functions do not change frequently.
- Many times, logical dataflow diagrams do not contain data stores other than files or databases, which are easier to draw than physical dataflow diagrams.
- Physical data flow graphs can be easily generated by modifying logical data flow graphs.
Benefits of Physical Data Flow Diagrams:
- Clarify which procedures are manual and which processes are automated: Manual procedures require detailed documentation, while automated processes require the development of computer programs.
- Describe the process in more detail than a logical data flow diagram: describe all the steps that process data.
- The sorting process must be done in a specific order: describe the sequence of activities that lead to meaningful results. For example, an update must be performed before a summary report can be generated.
- Identify temporary data storage: Describe temporary storage, such as sales transaction documents used in grocery stores for customer receipts (reports).
- Specify the actual names of files and printouts: The logical data flow diagram describes the actual file names and reports so that programmers can associate them with the Data Dictionary during the development phase of the system.
- Add controls to ensure the process is done correctly.
Conclusion
Thank you for reading our article and we hope you’ve enjoyed it. If you want to learn something about data lineage, we would like to advise you to visit Gudu SQLFlow for more information. As one of the best data lineage tools, Gudu SQLFlow can not only analyze SQL script files, obtain data lineage, and perform visual display, but also allow users to provide data lineage in CSV format and perform visual display. (Published by Ryan on Sep 12, 2022)
Try Gudu SQLFlow Live

If you enjoy reading this, then, please explore our other articles below: